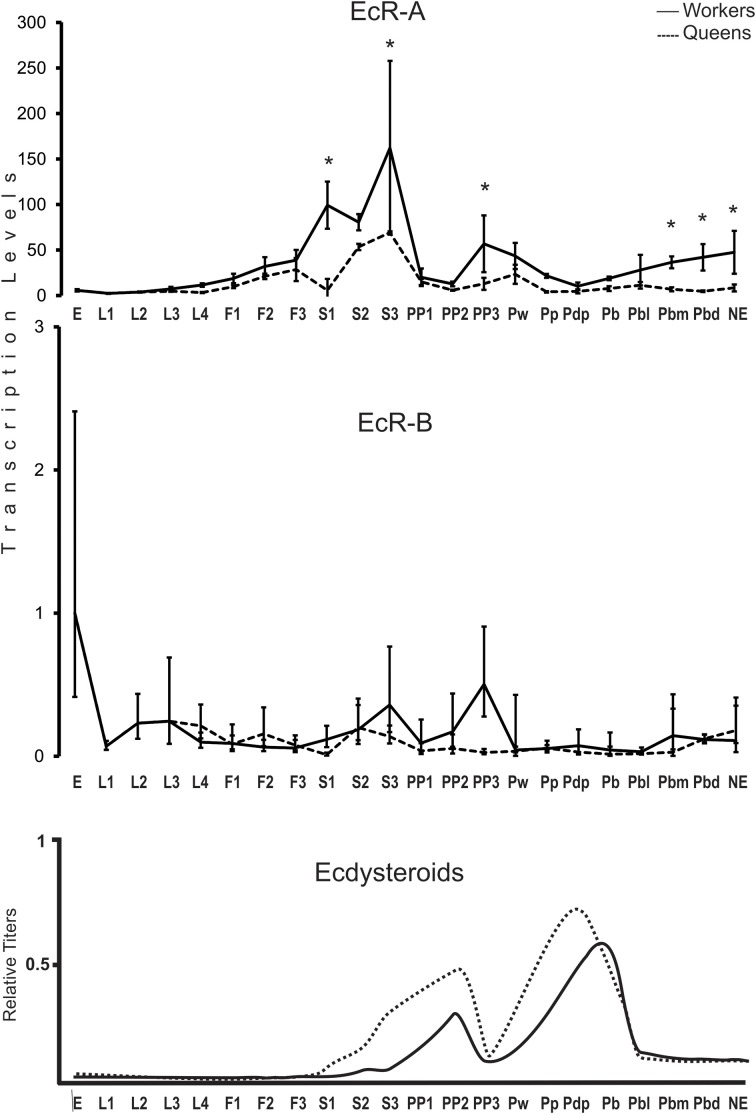
Figure 2.
Developmental expression profile of the EcR gene in A. mellifera queens and workers. EcR-A and EcR-B transcript levels were measured by RT-qPCR. Bars represent means ± S.E.M. of three biological replicates, each run as three technical replicates. Asterisks indicate a statistical difference (Mann–Whitney Test, P ≤ 0.05) between queens and workers for the respective developmental phase. See Table 1 for a description of the developmental phases. Hormone titers are based on Rachinsky et al. (1990) and Pinto et al. (2002).

