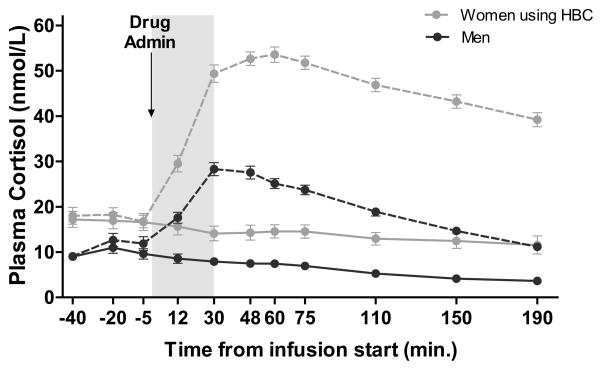
Figure 1. Plasma cortisol after hydrocortisone (IV, 0.1 mg/kg) or placebo administration.
Plasma cortisol levels are measured in nmol/L. Dashed lines represent plasma cortisol levels during the session in which hydrocortisone (0.1 mg/kg infused over 30 min) was administered. Solid lines represent plasma cortisol levels during the session in which placebo (0.9% saline) was administered. The gray bar indicates the time of drug infusion (0 to 30 min.). Area under the curve increase (AUCi) in plasma cortisol levels was significantly greater in women, all of whom were taking HBC, vs. men following hydrocortisone administration (t[42] = 10.13, p < 0.001). This difference was not found following placebo infusion.

