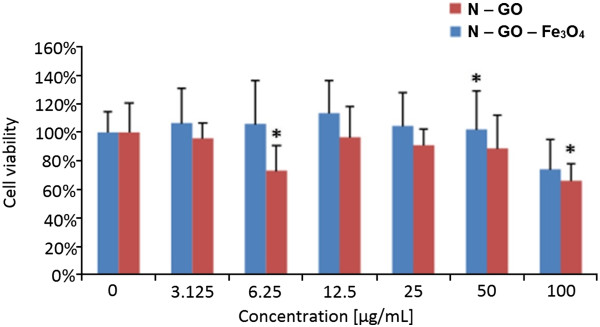
Figure 10.

Relative viability of fibroblast cell line L929 exposed to N-GO and N-GO-Fe3O4hybrid. The cell viability is presented as percentage of the mean value. Bars represent standard deviation. Symbol asterisk indicates statistically significant difference (p < 0.05).
