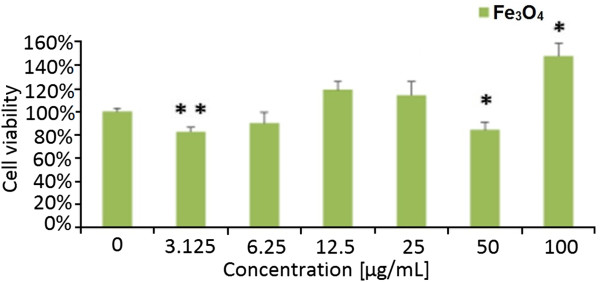
Figure 11.

Relative viability of fibroblast cell line L929 exposed to Fe3O4nanoparticles. The cell viability is presented as percentage of the mean value. Bars represent standard deviation, and symbol asterisk indicates statistically significant difference (p < 0.05).
