
Figure 2.
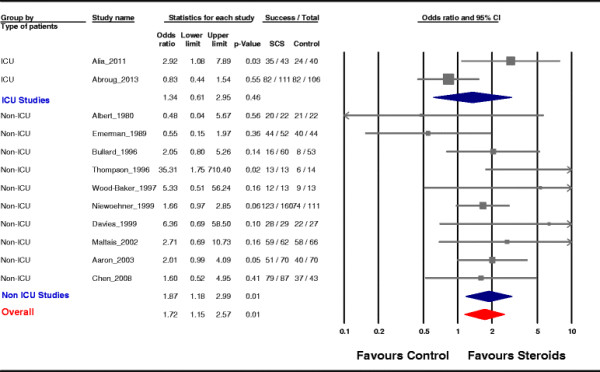
Pooled subgroup analysis. Effects of corticosteroid treatment on the success rate inferred from all included studies and separately for the groups of studies on ICU patients and on non-ICU patients. Gray squares represent odds ratios (ORs) in individual trials with the size proportional to the weight of the study. The 95% confidence intervals (CIs) for individual trials are denoted by lines. The pooled subgroup estimate of the effect is represented by the blue diamond (with a width proportional to the confidence interval), and the combined overall effect is represented by the red diamond. The I2 test for heterogeneity was moderate overall (I2 = 36%), high in the analysis involving critically ill patients (I2 = 77.4%), and low in studies including non-ICU patients (I2 = 17.4%). The z test for interaction between subgroups was 0.36 (p = 0.72). The meta-analysis is performed by a random effects model.