Figure 2.

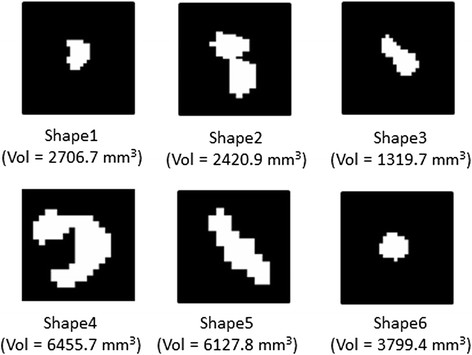
Original binary masks (axial view) of example lesion shapes created from real patient data. Volume (Vol) of each lesion is shown below each mask.

Original binary masks (axial view) of example lesion shapes created from real patient data. Volume (Vol) of each lesion is shown below each mask.