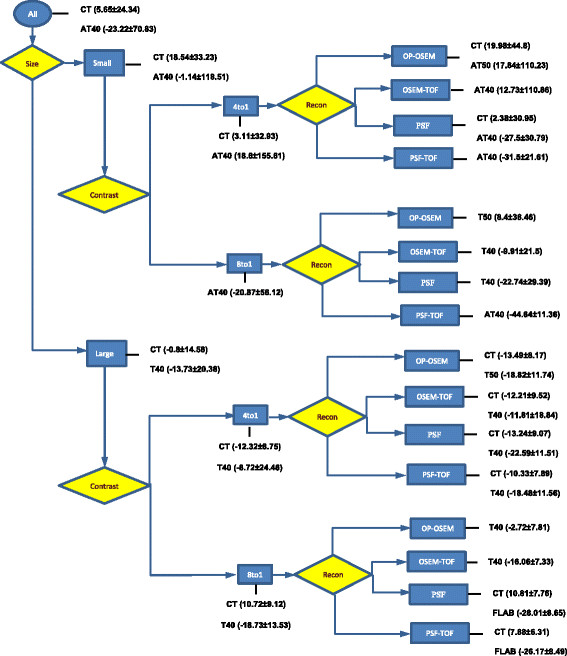
Figure 9.

Flow chart summarising methods’ performance for each parameter setting on NEMA IQ data. The parameters are shown as diamonds and are ordered from high to low impact from left to right. The options for each parameter are presented in rectangles and the best performing method this type of data is presented alongside these rectangles. The methods are ordered according to accuracy and the corresponding %VE ± SD are provided between brackets.
