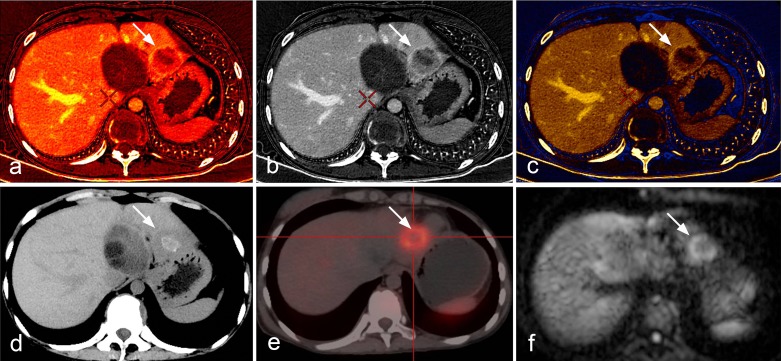
Figure 10.
Comparison between spectral CT, PET-CT and MR-DWI images. (a, b, c) The iodine map clearly delineates the well-perfused parts of hepatic alveolar echinococcosis in the marginal zone; (d, e) the enhanced and perfused region of AE in spectral CT was consistent with PET-CT image that displayed high uptake, and (f) MR-DWI that displayed high signal.

