
Figure 3.
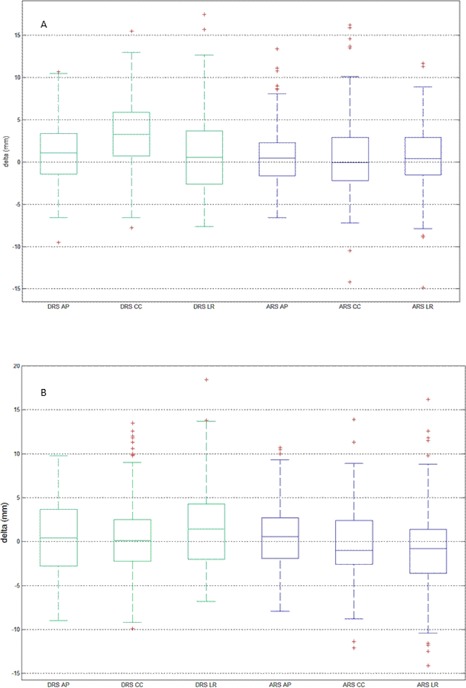
Box plots of the daily surface data for all patients () for the entire surface ROI (a) and the breast surface ROI (b) (). Box lines show the 25th, median, and 75th percentile values. The bars indicate the smallest and largest nonoutlier values. Red crosses designate outliers that are values beyond 1.5 (indicated by astericks) interquartile range from the 25th and 75th percentile values.