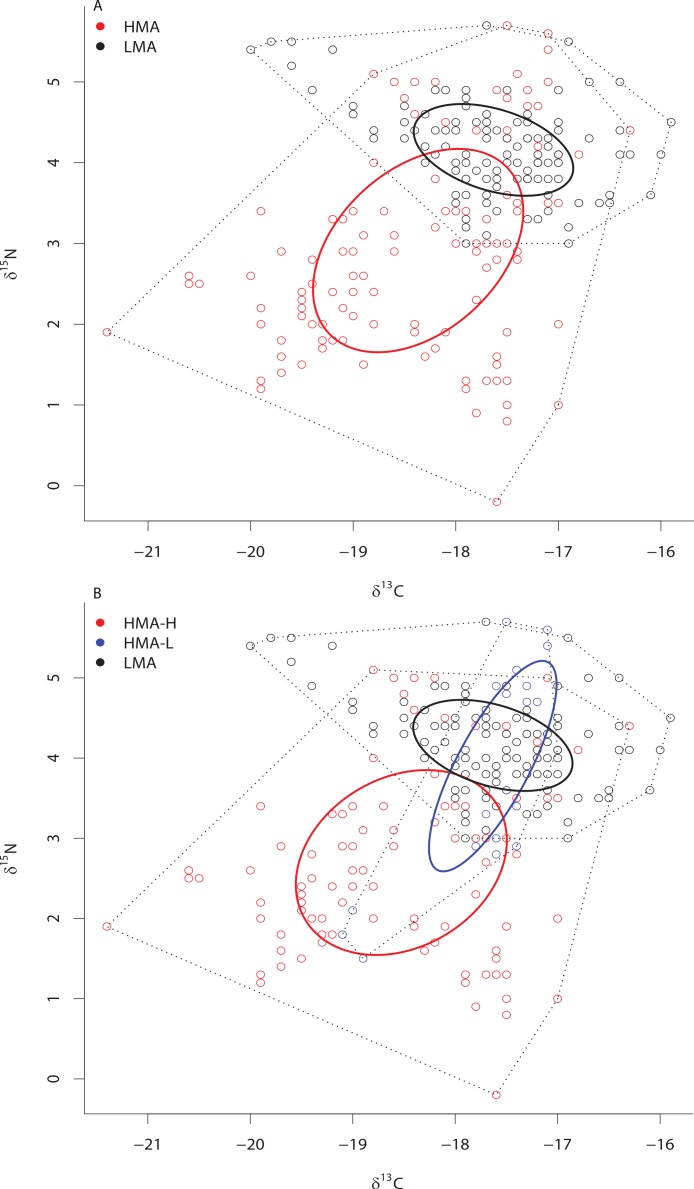
Figure 2. Bivariate δ13C and δ15N plot depicting the placement of HMA and LMA (A) and HMA sponges with high and low chl a concentrations (HMA-H and HMA-L, respectively) and LMA groups (B) within the isotopic niche space of the Miskito Cays.
Standard ellipse areas (SEAc) depicted by solid lines provide estimates of the niche area of each of these groups using Bayesian inference as in Jackson et al. (2011). Convex hulls depicting total niche width of each group are shown using dashed lines for reference Layman et al. (2007a).

