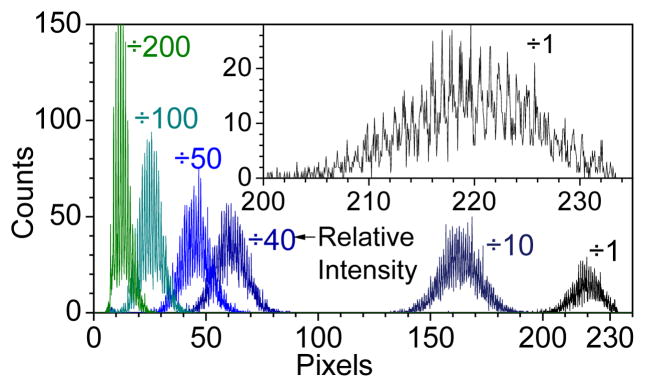
Figure 13.

Plot of the pulse amplitude distributions for the pixel-conditioned SSPM detector illuminated with a pulsed LED at 7 different intensities, labeled “÷200” to “÷1”. The strongest light pulse is labeled “÷1”. Notice the resolution of the multiplicity in the number of pixels triggered by the LED pulse, which is the fine structure illustrated in the expanded plot at the upper right corner.
