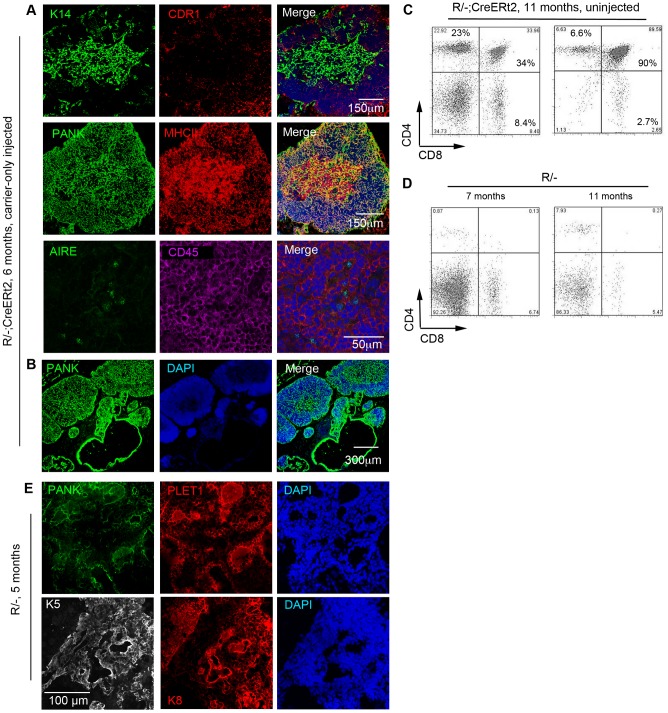
Figure 4. Spontaneous reversion of the R allele in aged R/-; CreERt2 mice.
Images show representative immunohistochemical analysis of carrier-only injected 6 month-old R/−; CreERt2 mice analyzed one month after injection. (A) Carrier-only injected mice exhibited a thymus structure containing both cortical and medullary regions (cytokeratin 14 (K14) and CDR1 indicate medullary and cortical TEC respectively, while pan cytokeratin identifies all TEC). Scale bar: 150 um. B, the thymic region of a carrier-only injected mouse, showing a series of small thymic lobes. Scale bar: 300 µm. (C,D) Plots show analysis of thymocytes for CD4 and CD8 expression after gating on live CD45+ cells for (C) two randomly selected, untreated 11 month old R/−; CreERt2 mice and (D) two untreated R/− mice (7 m and 11 m old, respectively). Each of the untreated R/−; CreERt2 mice contained DP cells within the CD45+ population (33.9% and 85.6%, respectively) while the R/− mice contained no DP cells (mean±SD: Untreated R/−; CreERt2 mice, 6 months old, 48.20%±40.88%, n = 5; 11 m old, 61.78%±39.34%, n = 2. R/− controls 1.09%±1.55%, n = 2). Of note is that the CD4+ and CD8+ single positive populations present in the aged R/− mice are also commonly observed in aged nu/nu mice, and are thought to arise by homeostatic expansion of extrathymically-generated T cells [30]. (E) Representative images of thymic rudiments from 5 month-old R/− mice after immunohistochemical analysis with the markers shown.

