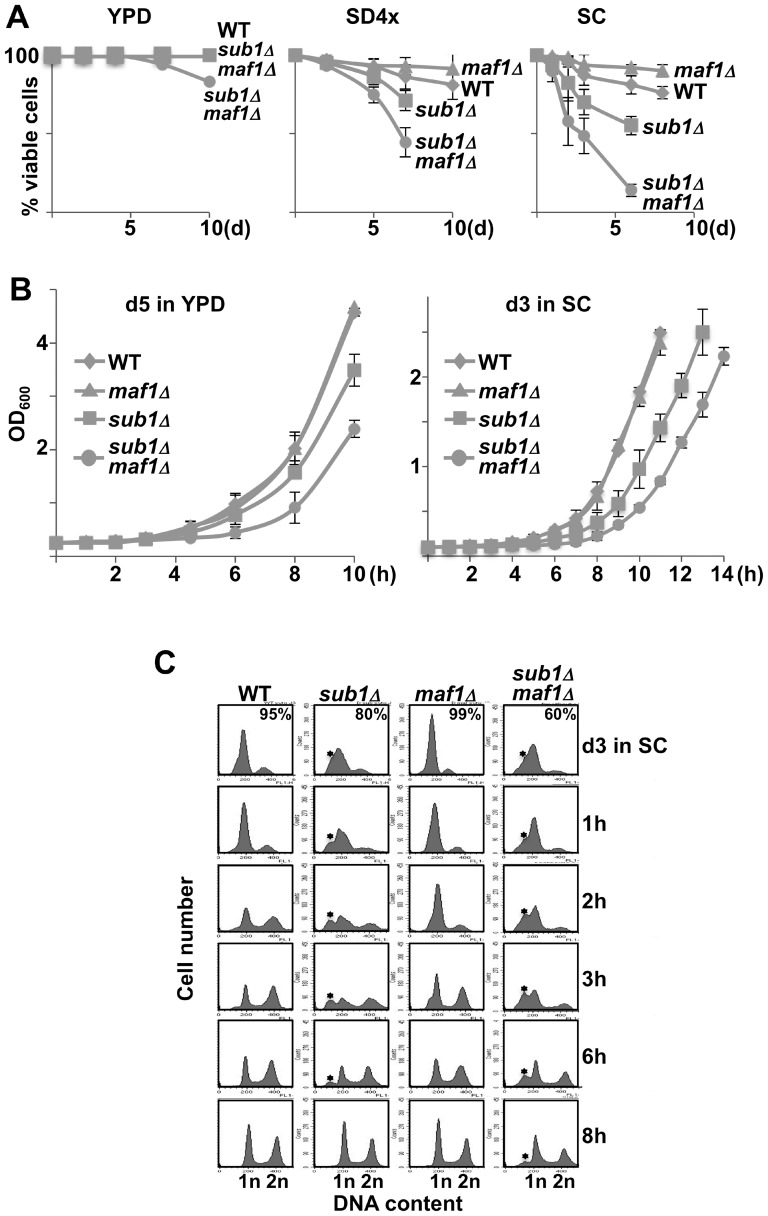
Figure 1. Loss of Sub1 results in a premature death and a delay to exit from resting.
(A) Viability of the indicated strains (all uracil prototrophs, see Materials and Methods) grown in YPD, SD4x or SC medium was determined over time by trypan blue exclusion assays. Viability curves represent means and standard deviations from at least three independent experiments. (B) The same number of viable cells determined by trypan blue staining of day5 or day3 samples in YPD or SC medium, respectively, was re-inoculated into fresh media. Optical density at 600 nm was monitored over time as a measure of regrowth. The standard deviations were calculated from at least three independent experiments. (C) Day3 cultures in SC medium were re-inoculated into fresh media and DNA content was determined over time by flow cytometry. The percentage of viable cells in the resting cultures is indicated. The star indicates the position of sub-G1 peaks corresponding to apoptotic DNA degradation. The percentage of cells in each phase was determined using the cell cycle modelling software ModFit LT 4.0 and is shown in S2 Fig.

