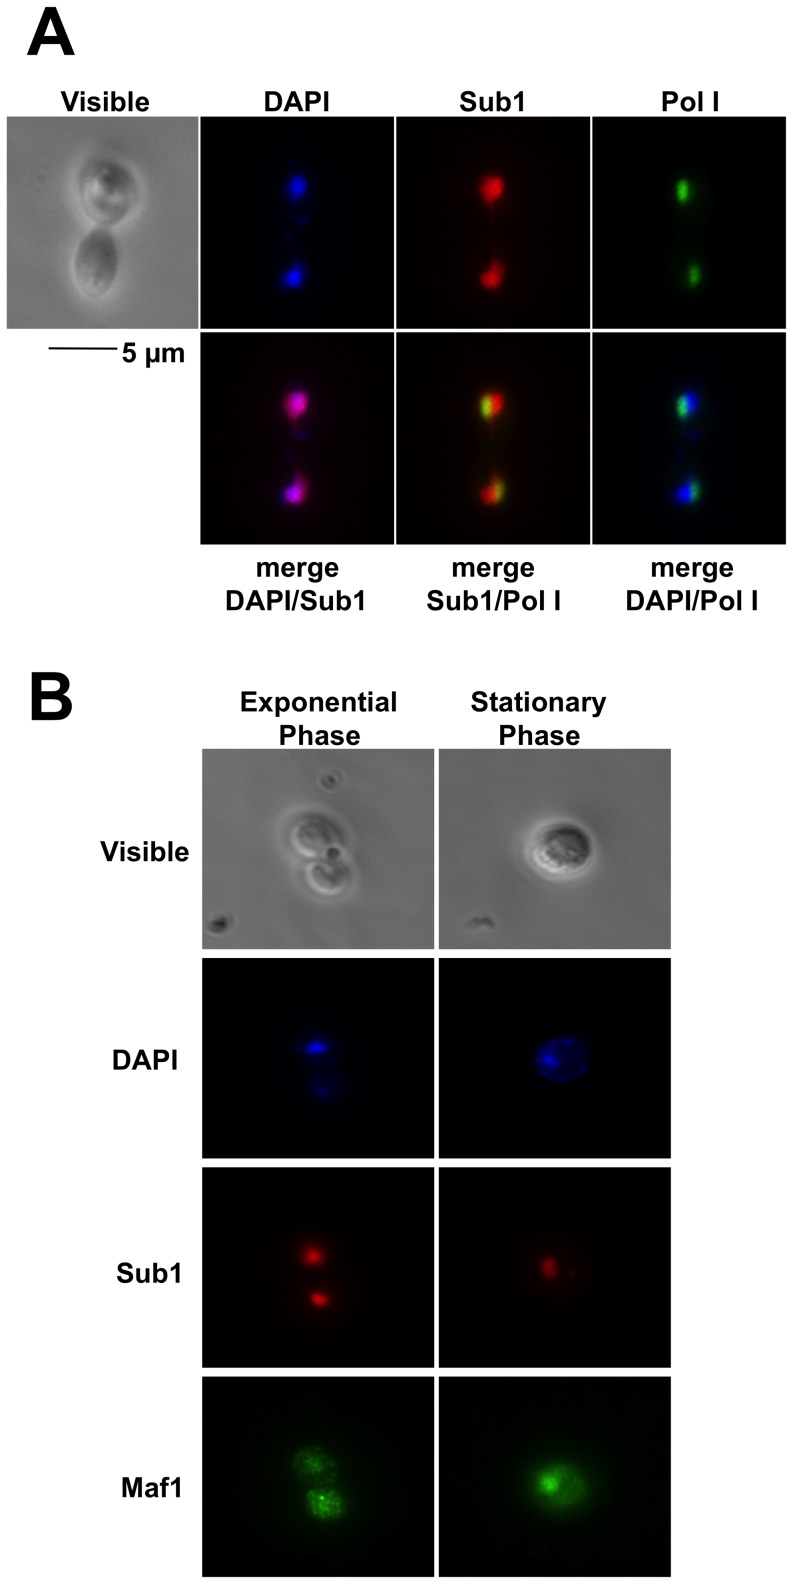
Figure 8. Intracellular localization of Sub1.
Sub1 and Pol I (A) or Sub1 and Maf1 (B) were localized by immunofluorescence in exponentially growing cells in YPD or at day5 stationary phase, as indicated. The cells were analysed by phase contrast light microscopy (visible), by DNA staining (DAPI) and by immunofluorescence using antibodies specific to Sub1, Pol I or Maf1, as indicated. Overlays from the indicated combinations of images are shown.

