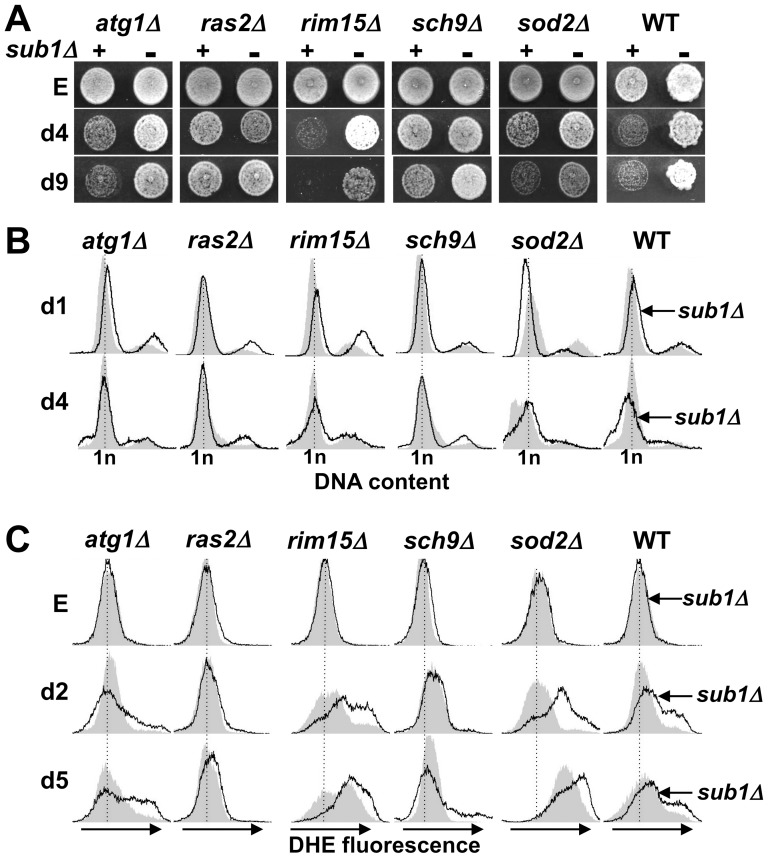
Figure 9. Inactivation of the Ras/PKA or Tor1/Sch9 signalling networks suppresses the effect of Sub1 deletion on quiescent cell survival.
(A) Samples of the indicated strains, all uracil prototrophs, grown in SC medium to exponential phase (E) or at day5 and day9 were spotted onto YPD plates and incubated at 30°C. The growth of single (-) null mutants was compared to that of their combination with Sub1 deletion (Set 2, +). (B) The indicated strains were grown to stationary phase in SC medium. Changes in DNA content at day1 and day4 were determined by flow cytometry. The filled grey curves represent the profiles of single null mutants, the black lines that of their combination with Sub1 deletion. (C) ROS levels in the indicated strains grown to exponential phase (E) or at day2 and day5 were measured with DHE staining and flow cytometry. The filled grey curves represent the profiles of single null mutants, the black lines that of their combination with Sub1 deletion.

