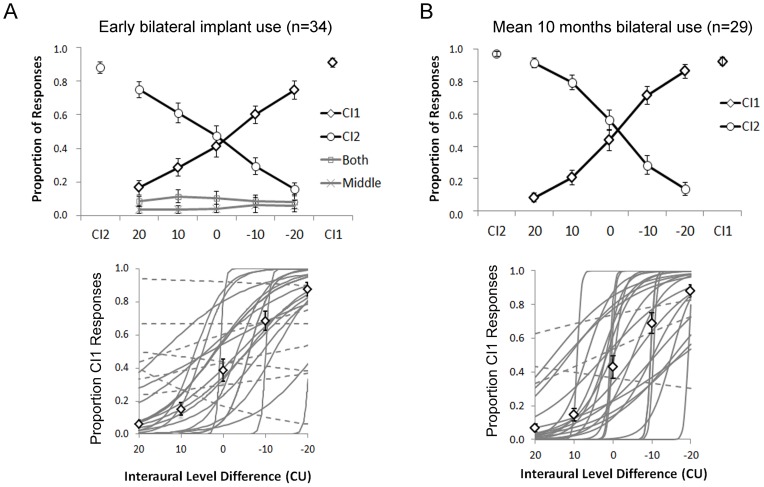
Figure 1.
A)Thirty four adolescents responded to bilateral input either with no intended interaural level differences (ILD = 0) as indicated by equal amplitudes of auditory brainstem responses or with ILDs of 10 or 20 weighted to the second CI (positive values) or first CI (negative values) at early stages of bilateral implant use (0.14±0.01 year). Unilateral stimuli (CI1 and CI2) were also presented randomly to ensure the task was understood. Upper plot: Mean (±1 SE) proportion of responses from all participants. Mean responses to unilateral stimuli were>0.88 accurate. Significant changes in mean proportion of responses occurred with changing ILD (CI1 responses: p<0.0001, CI2 responses: p<0.001). ILDs of 20 CU (+ values indicate CI2 weighted and – values indicate CI1 weighted) were perceived to come from the correct side in 0.75 of trials with decreasing certainty for ILDs of 10 CU ILD and no significant difference between proportion of CI1 and CI2 responses when no ILDs were provided (ILD = 0) (p>0.05). Lower plot: Logit regression analyses of the proportion of right responses from each child revealed significant changes in 21 participants (solid lines) and non-significant changes in 9 participants (dashed lines). Data from 4 children was excluded from analysis because <0.67 of responses to unilaterally presented stimuli were accurate. White diamonds represent mean (±1 SE) data from significant regression curves. B) ILD perception was retested after 0.86±0.03 year of bilateral use in 29 of the 34 children. The “middle” and “both” choices were not accepted at this test time. Upper plot: significant change in mean responses were found with changing ILD (CI1 and CI2 p<0.0001). Lower plot: 25 of 29 adolescents showed significant changes in proportion of CI1 responses with ILD (solid lines), 3 had insignificant changes in responses (dashed lines), and data from 1 participant was excluded because responses to unilaterally presented stimuli were accurate on <0.67 of trials. White diamonds represent mean (±1 SE) data from significant regression curves.

