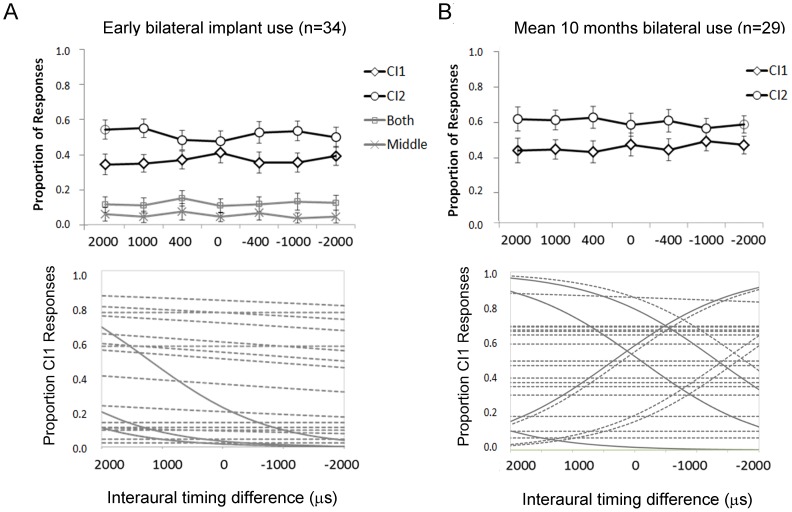
Figure 4.
A) Upper plot: Mean (±1 SE) proportion of responses to changes in interaural timing differences (ITDs) at early stages of bilateral implant use (0.14±0.01 year). Positive values lead from the newly implanted ear (CI2) and negative values from the more experienced ear (CI1). Most responses are to either CI1 or CI2. No significant changes were found for CI1 or CI2 responses with ITD changes (p<0.05). Lower plot: Logit regression curves for proportion of right responses from each participant reveal non-significant slopes in 15 participants (dashed lines) and significant slopes (solid lines) in 4 participants but in the opposite direction from expected. Data could not be analyzed in 2 children as all responses were to CI2, 3 children were excluded from individual because of non-significant changes in responses to interaural level differences (shown in Figure 1A), and 1 was excluded because responses to unilateral stimuli were <67% accurate. B). Upper plot: No significant changes in CI1 or CI2 responses were found after 0.86±0.03 year of bilateral use. Lower plot: Logit regression curves showed non-significant changes in 17 participants (dashed lines) and significant changes in 6 participants (solid lines) although 1 was in the opposite direction from expected. Data could not be analyzed in 2 adolescents who indicated CI2 for all responses, 3 participants with non-significant changes with interaural level differences (Figure 1B) and 1 whose responses to unilaterally presented stimuli were <67% accurate.

