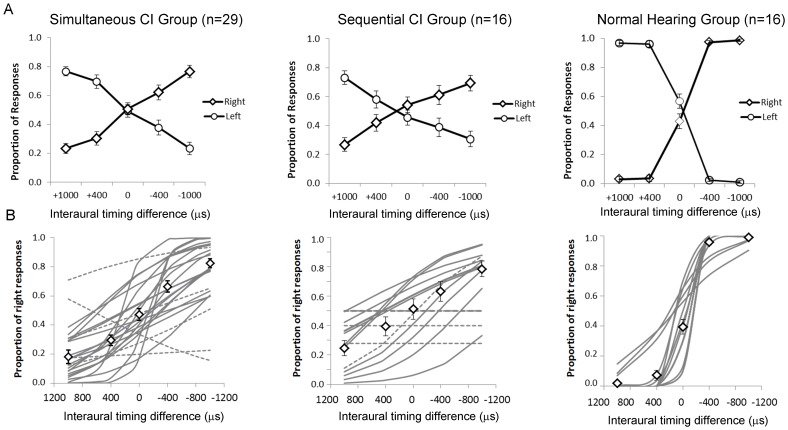
Figure 5.
A) Mean (±1 SE) proportion of responses from all participants in three groups. Positive interaural timing differences (ITDs) indicate bilateral stimuli leading from the left and negative values indicate right leading stimuli. CI groups had long term bilateral implant experience (Simultaneous Group: 4.31±1.10 years; Sequential Group: 5.30±1.55 years). Mean responses from the Normal Hearing Group are essentially at ceiling for all ITDs>0. B) Logit regression analyses of data from individual children are shown (solid lines = significant regression curves; dashed lines = non-significant regression curves). Twenty of 25 in the Simultaneous Group significantly detected changes in ITD (data from 5 were not analyzed as detection of interaural level cues shown in Figure 2B was not significant). Eleven of 16 children in the Sequential Group showed significant changes. There was no significant difference between these proportions (Mann-Whitney U = 177.5, p = 0.42). Significant changes were found in all children in the Normal Hearing Group.

