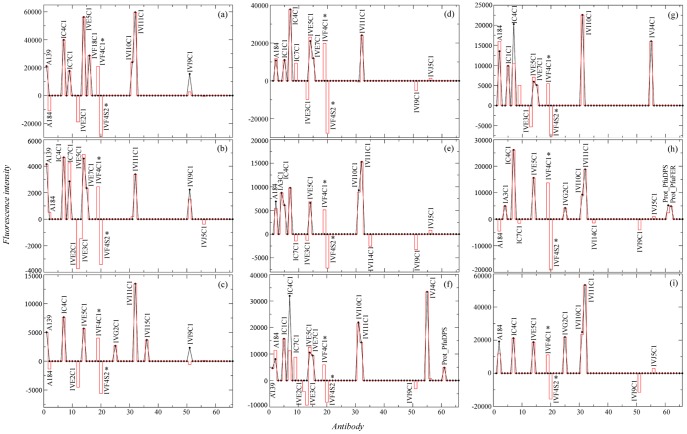
Figure 3. Deconvolution applied to sandwich microarray immunoassays from BF1a (a), BF1b (b), BF1c (c), BF2a (d), BF2b (e), BF2c (f), BF2d (g), BF2e (h) and BF2f (i) transect biofilm extracts.
Black lines represent the experimental fluorescence intensities and red lines represent the deconvoluted signals. Antibodies are numbered according to the list shown in S2 Table. Antibodies marked with asterisks represent spurious results (for details see ref. [21]).

