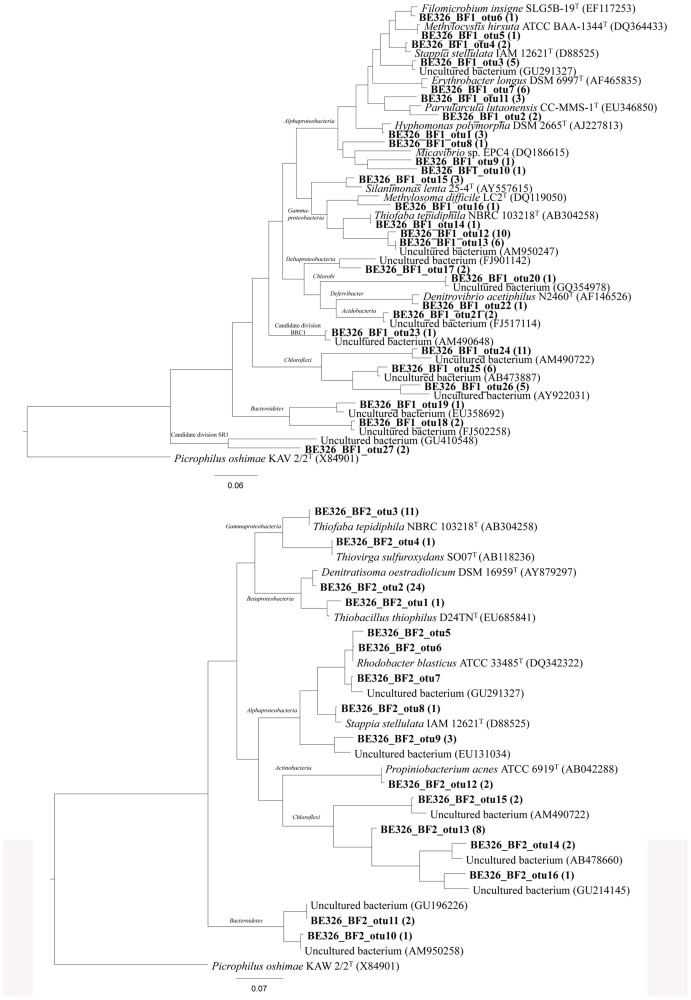
Figure 6. Phylogenetic affiliation of the 16S rRNA gene sequences retrieved from BF1c (upper part) and BF2d (bottom part) transect samples biofilms.
A maximum-likelihood (PHYLML) phylogenetic tree was chosen as a consensus tree, after reconstructing the phylogeny by using different algorithms, substitution models and filters. The trees show the relationship between representative 16S rRNA gene clone sequences from BF1c and BF2d (in bold) and related strains and environmental clones from different bacterial phyla. The number of sequences grouped into that specific OTU is indicated in parentheses. Positional filters were applied to discard high variable positions and a total number of 490 and 570 columns respectively, were finally compared. Taxonomic classification according to Silva104 database is also shown. The scale bars represent 7 and 6% nucleotide substitutions per sequence position respectively.

