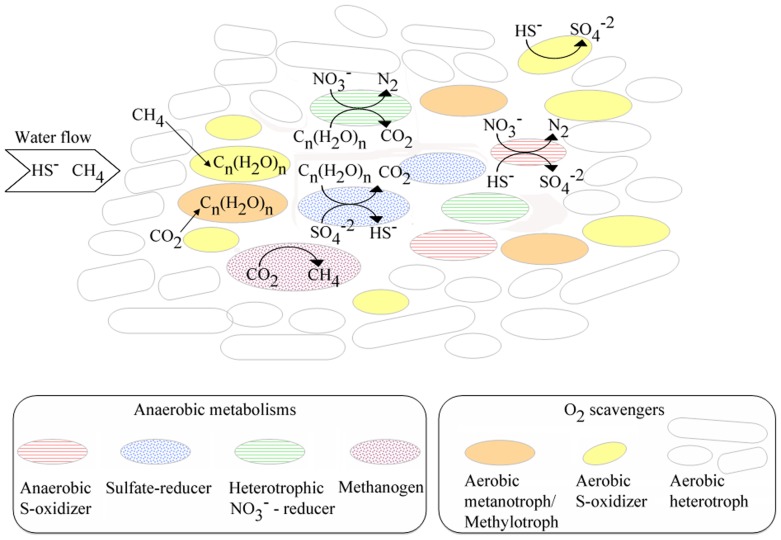
Figure 7. Syntrophic metabolisms in deep South African mine biofilms inferred from the complementary deconvolution method and the phylogenetic analysis.
Metabolisms inferred from both methods are represented by solid circles (aerobic heterotrophs: white circles; aerobic S-oxidizers: yellow circles, and metanotrophs: orange circles), metabolisms inferred by deconvolution analysis by dotted circles (methanogens: purple circles and SRB: blue circles) and metabolisms inferred by 16S rRNA gene sequencing analysis are represented by horizontal lined circle (heterotrophic nitrate-reducers: green circle and anaerobic S-oxidizers: red circle).

