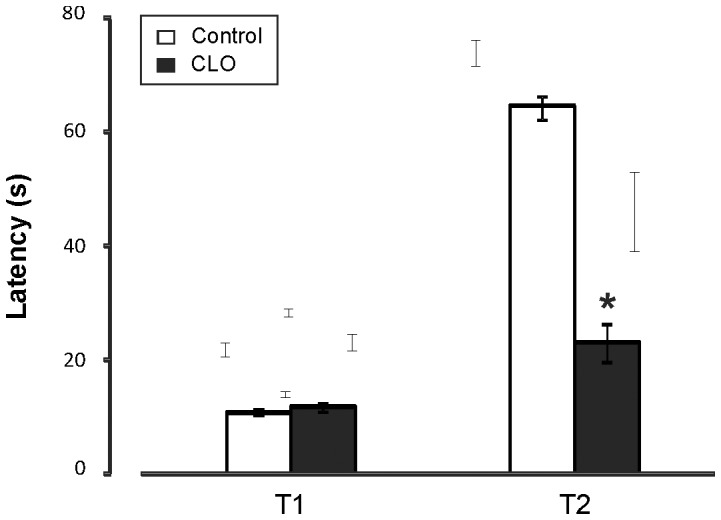
Figure 3. Nociceptive and behavioral responses in the hot-plate test after clonidine treatment.

The first latency (T1, in seconds) shows the sensibility of clonidine-treated mice compared with control mice. The second latency (T2) shows the behavioral response as the third escape attempt, greater in control mice. N = 21∶21. * significant differences between wild-type (WT) and clonidine (CLO) -treated mice, when p<0.05.
