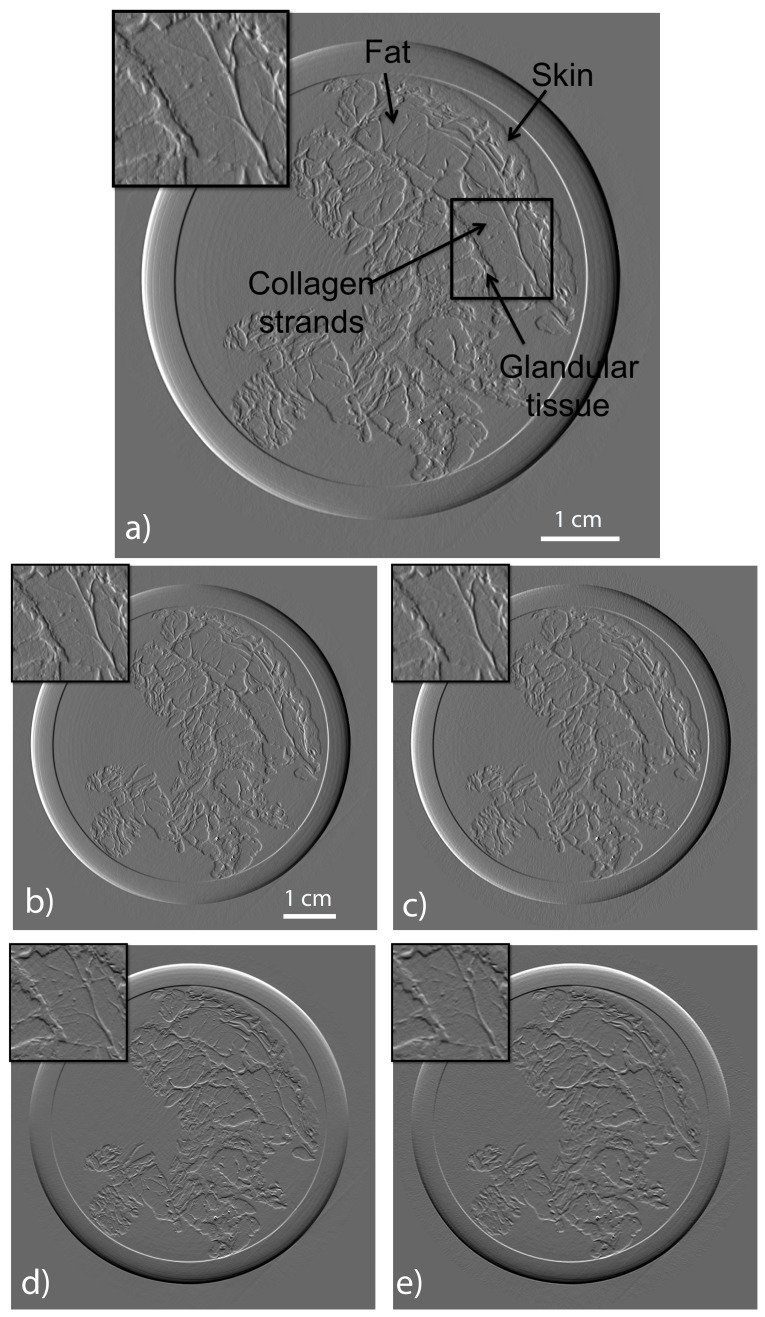
Figure 7. Reconstruction of a computed tomographic slice of the breast.
The images on the first and second row are the X and Y phase gradients, respectively. In the left column the results of the reconstruction obtained with the FBP method using the full set of data are reported. In the right column the results of our method using one projection over five are shown. For these reconstructions we set  and
and  .
.

