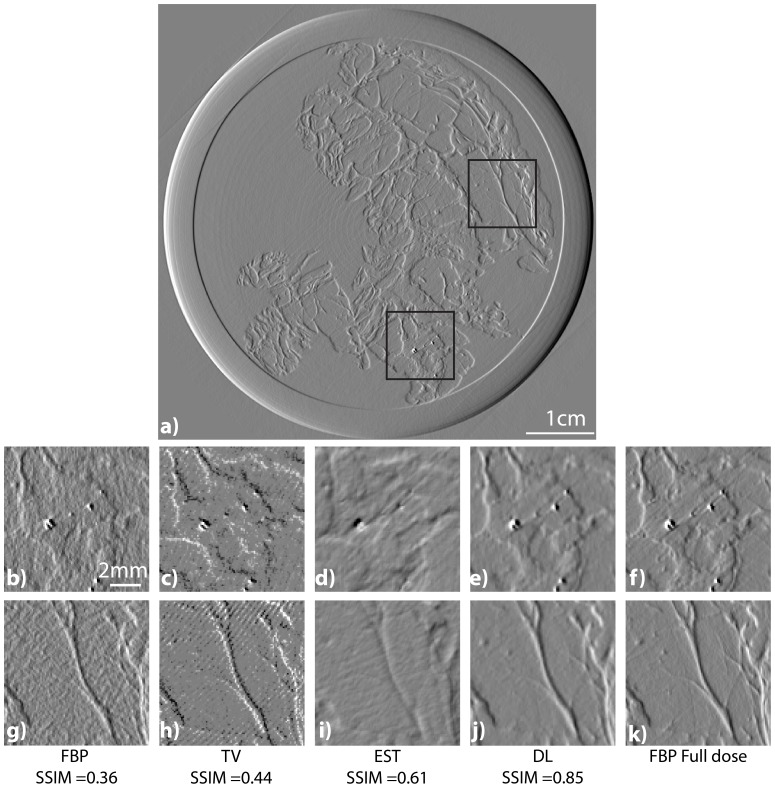
Figure 8. Comparison of the tomographic image reconstructions of the breast obtained with the FBP (b and g), the TV minimization (c and h), the EST (d and i), and our method (e and j) using 200 projections over the 1000 available.
The right images (f and k) are the images computed with the FBP using the entire set of projections. The top image (a) is the result obtained by the FBP using the entire set of projections. It is reported for showing the location of the insets. The SSIM values are reported based on the FBP full dose image.

