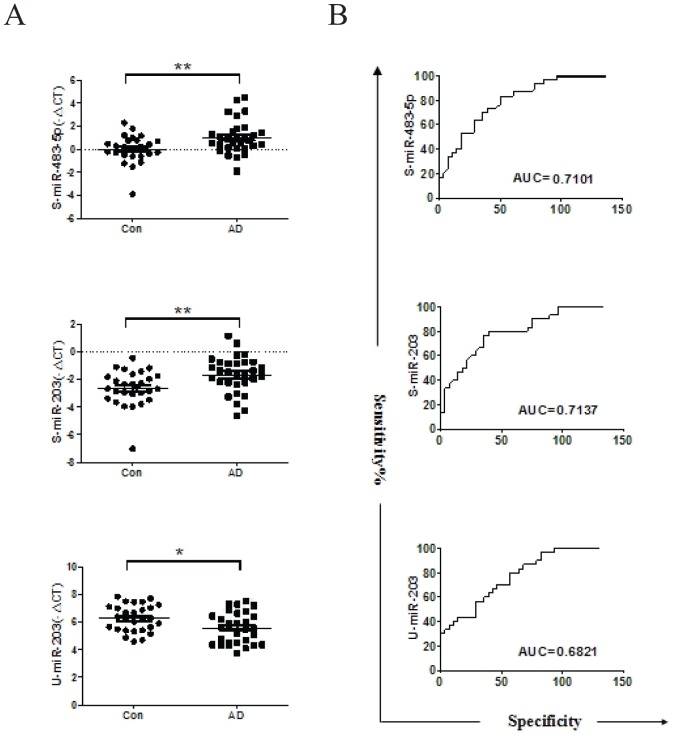
Figure 2. Validation of selected miRNA expression levels.
A. Expression of two miRNAs in serum (S-miR-483-5p and S-miR-203) and one in urine (U-miR-203) were measured by quantitative real-time PCR were in 30 children with AD and 28 healthy children. The 2-△△CT method in one subject with children with AD was normalized to 1. miR-374a expression was considered as control. *P<0.05, **P<0.01. B. ROC and AUC analysis for the ability of serum miRNAs (S-miR-483-5p and S-miR-203) and urine miRNA (U-miR-203) were performed. ROC Curve analysis shows the sensitivity (y-axis) and specificity (x-axis) of a standard of potential biomarkers.

