Figure 3.

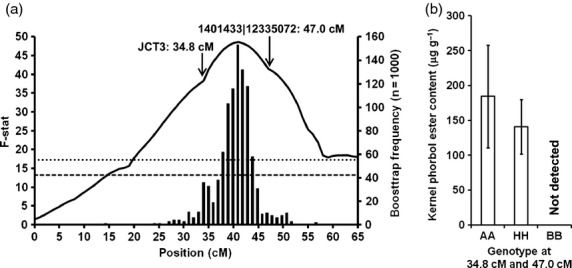
(a) QTL analysis of phorbol ester content based on seeds collected from 120 F2 plants in mapping population G33 × G43 for linkage group 8. Left y axis: The solid black line shows the F-stat score obtained using GridQTL. The horizontal lines show the genome-wide significance thresholds at P = 0.05 (lower, dashed) and P = 0.01 (upper, dotted) based on 1000 iterations. Right axis: The vertical bars show the QTL distribution calculated using bootstrap analysis (n = 1000). (b) Kernel phorbol ester content of seeds collected from F2 plants which were homozygous at two markers flanking the seed toxicity locus (‘AA’, G33 allele), heterozygous (‘HH’), or homozygous (‘BB’, G43). The error bars represent the standard deviations.
