
Figure 1.
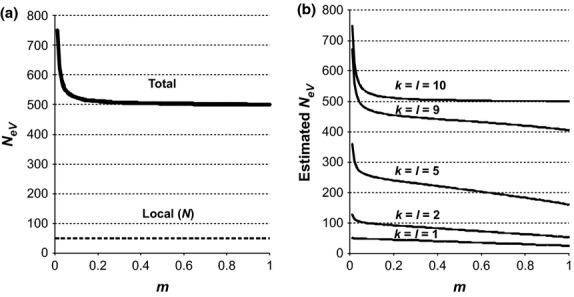
True (a) and expected estimated (b) variance effective size (NeV) at different migration rates (m) for an island model population system in approximate migration–drift equilibrium with s = 10 subpopulations of effective size N = 50. The expected estimates in (b) refer to a situation where the same 1, 2, 5, 9 or 10 subpopulations were sampled in two consecutive generations (k = l; see text for details).