
Figure 2.
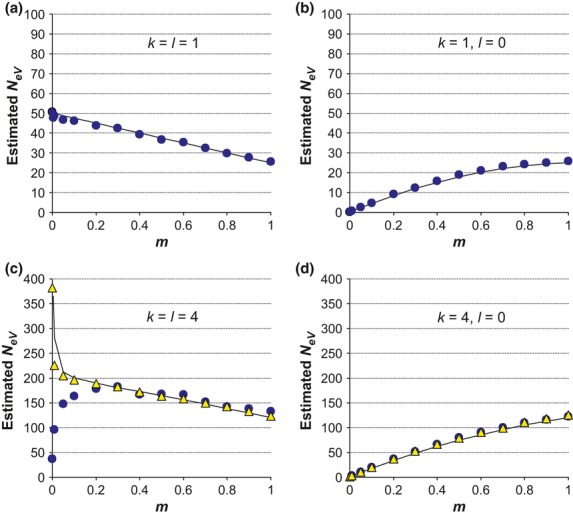
Expected and simulated estimates of NeV at different migration rates (m) for an island model population system in approximate migration–drift equilibrium with s = 10 subpopulations of effective size N = 50. The populations sampled in t and t + 1 are either the same (k = l) or different ones (l = 0), l symbolizing the amount of overlap. Solid lines represent derived expected values (eqn 7 and 8) and symbols simulated results. Note the different scales of the y-axes. (a, b) NeV was estimated by sampling from a single subpopulation in each generation (k = 1). The populations sampled in t and t + 1 are either the same (a; k = l = 1) or different ones (b; l = 0). Simulated sample size is n = 100 diploid individuals in each generation. (c, d) As above, except that k = 4, subpopulations are sampled in each generation and random sampling of a total of n = 80 (circles) or n = 800 (triangles) individuals from the four subpopulations available for sampling (corresponding to an average of n/k = 20 or n/k = 200 individuals sampled from each subpopulation). The four subpopulations sampled in t + 1 are either the same (c; k=l = 4) or different from those in t (d; l = 0).