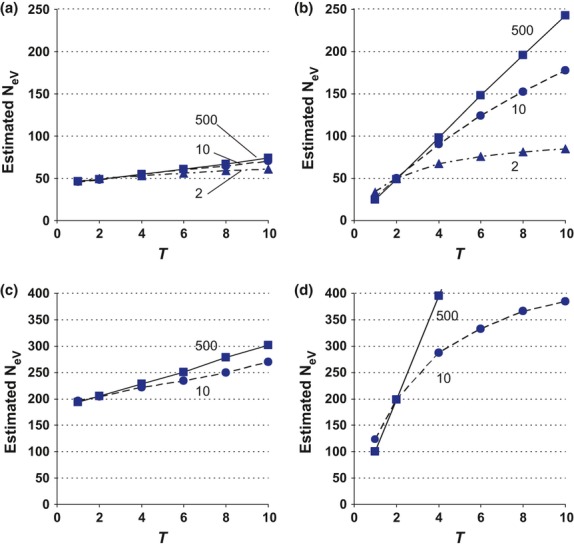
Figure 3.

Simulated estimates of variance effective size when measuring allele frequency shifts over T = 1–10 generations and sampling the one and same (k = l = 1, top, a and b) or the same four (k = l = 4, bottom, c and d) subpopulations in population systems comprising s = 2, 10 or 500 subpopulations with migration rates m = 0.1 (left, a and c) and m = 1 (right, b and d). Within each panel, the curves are labelled with respect to s. The number of individuals sampled in each generation is n = 100 in (a) and (b), and n = 800 in c and d (cf. Fig.2). Note the different scales of the y-axes, and that four subpopulations cannot be sampled when s = 2 (bottom, c and d).
