Figure 1.

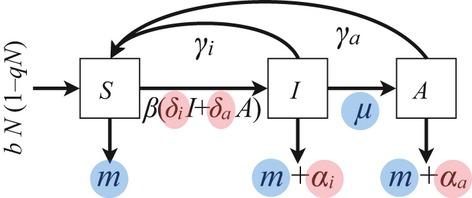
Schematic of the population dynamic models. Host evolution affects parameters highlighted in blue (m and μ) and pathogen evolution those in pink (α and δ).

Schematic of the population dynamic models. Host evolution affects parameters highlighted in blue (m and μ) and pathogen evolution those in pink (α and δ).