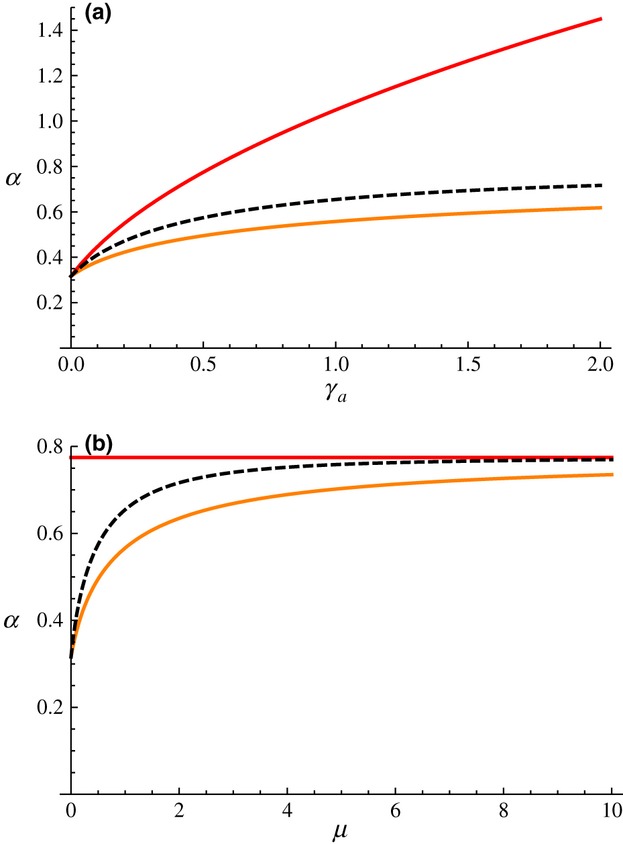
Figure 2.

Pathogen's ES level of virulence, plotted against (a) the host's recovery rate  and (b) the rate of activation of the immune response μ. The dashed black line shows the ES virulence
  of nonplastic pathogens, whereas the amber and red lines show the respective ES levels
  and
and  for plastic pathogens. Other parameter values:
