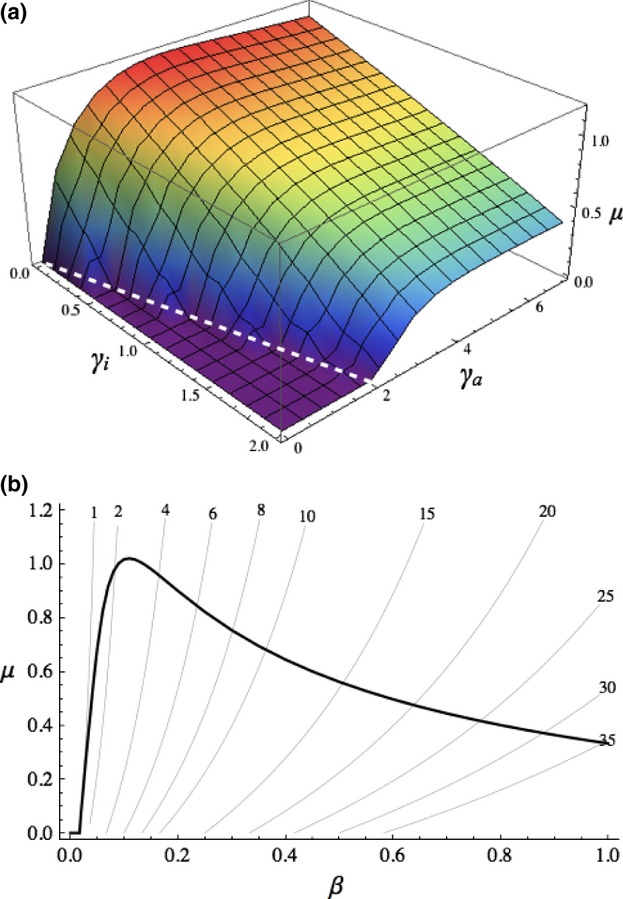
Figure 3.

Host's ES rate of activation μ plotted against (a) recovery rates  and
and  and (b) susceptibility to infection β. In both cases, the pathogen was nonplastic
  . (a) The white dashed line indicates
  . (b) Thin lines with numbered labels are
  isoclines. Parameter values as in Fig. 2, except (a) β = 0.2, (b)
  = 0 and
  = 1.
= 1.
