
Figure 5.
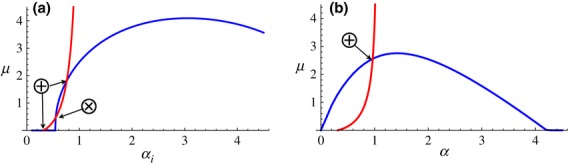
Host's ES rate of activation μ plotted against virulence levels: (a)  for a plastic pathogen and (b) α for a nonplastic pathogen. Blue lines show the host's ES rate of immune activation and red lines the pathogen's ES level of virulence. ⊕ indicates a coevolutionarily stable strategy and ⊗ a coevolutionary repeller. Parameter values as in Fig. 4.