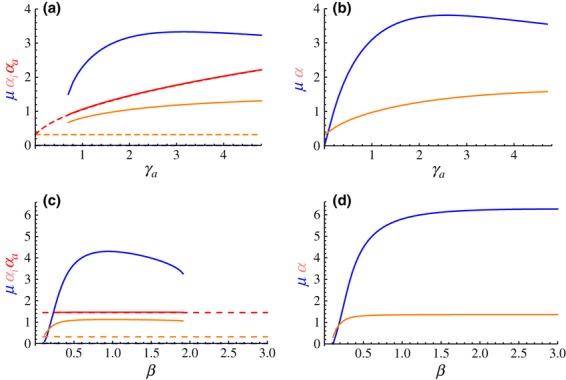
Figure 6.

Coevolutionary stable strategies plotted against (a, b) recovery rate  and (c, d) susceptibility to infection β. Blue lines show the host's immune activation rate μ. (a, c) Plastic pathogen: amber and red lines show the pathogen's respective virulence levels
  and
and  ; dashed lines show the lower CoESS, with μ = 0 (see Fig. 5a). (b, d) Nonplastic pathogen: amber lines show the pathogen's virulence level α.
