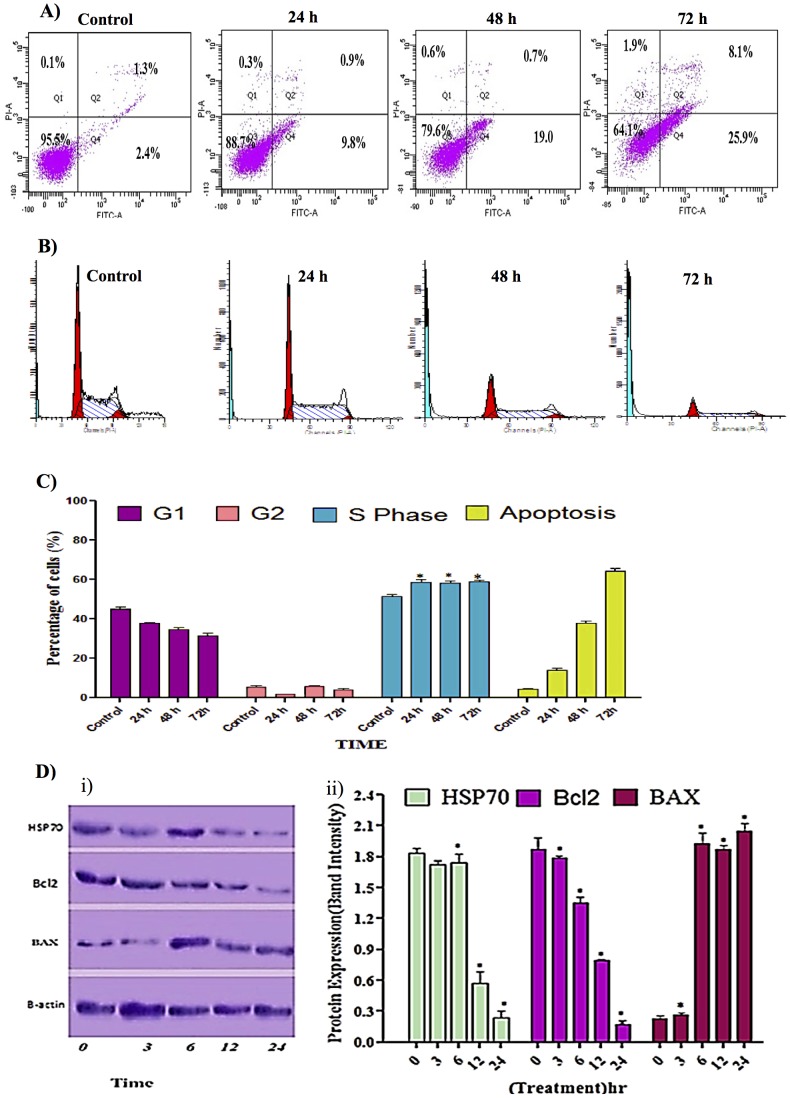
Figure 3. Effect of thymoquinone on early apoptosis, cell cycle analysis and protein expression.
(A) Staining with FITC-conjugated Annexin V and PI; cells were analyzed by flow cytometry. Control cells (no drug treatment), 24, 48 and 72 h were in a time-dependent manner. The early apoptotic events (Annexin+/PI-) are shown in lower right quadrant (Q4) of each panel. Quadrant (Q2) represents Annexin+/PI+ late stage of apoptosis/dead cells. (n = 2). (B) Histograms for cell cycle analysis. (C) Cell cycle graph; Induction of S phase arrest in the cell cycle progression. “*” Indicates statistically significant at p<0.05, where the arrest at 24, 48 and 72 h was individually compared to control. (D) Effect of thymoquinone on the levels of apoptosis regulatory proteins at 3, 6, 12 and 24 h with β- actin as a loading control, ‘*’ indicates statistically significant at p<0.05. Shapiro-Wilk test: Hsb70, P = 0.339; Bcl2, P = 0.57; Bax, P = 0.192, where P value are greater than α level of 0.05, showing that the data have normally distributed population.

