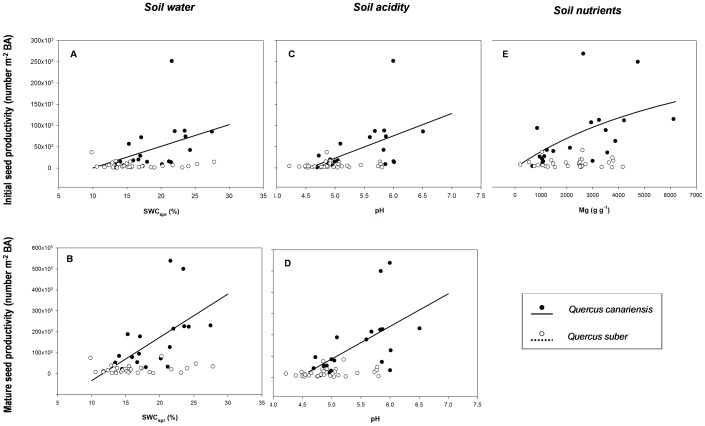
Figure 2. Influence of soil environment (soil water in spring, acidity and nutrients) on initial and mature seed productivity.
Values of individual-level seed productivity have been averaged for a time period of 10 years (from 2002 to 2012) and relativized by m2 of tree basal area. Quercus canariensis has been represented with black symbols and solid lines, whereas Quercus suber with white symbols and dashed lines. Lines represent the best-fitted models (details in S1 Table).

