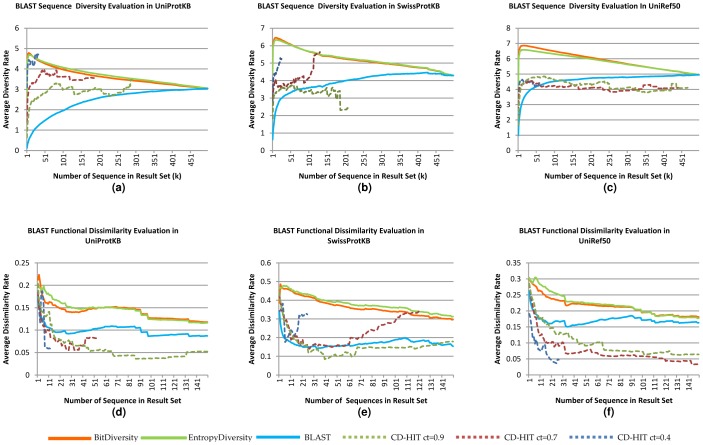
Figure 4. Comparisons based on sequence diversity and functional dissimilarity measures in different databases: UniProtKB, SwissProtKB and UniRef50.
The experiments are done by using OXBench dataset on BLAST Web services. For a, b, and c, the x axes represent the average sequence diversity rate calculated with Rao's entropy method and the y axes show the size of the diversified set(k). For d, e, and f, the x axes represent the average functional dissimilarity rate based on Wang et al.'s similarity on molecular function GO DAG. The y axis is the same as the a, b, and c.

