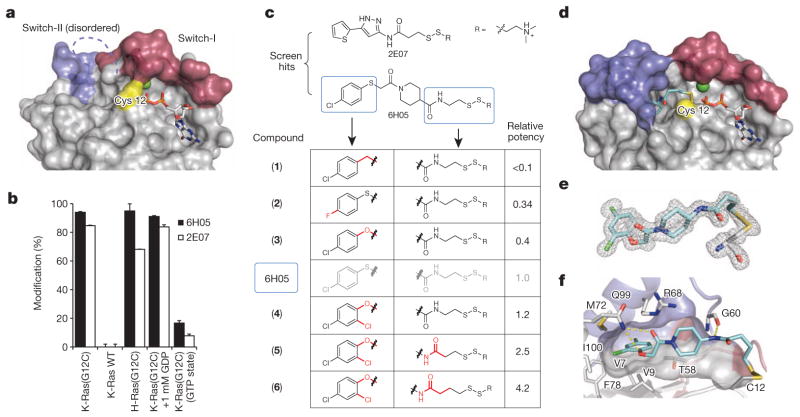
Figure 1. Tethering compounds selectively bind to oncogenic K-Ras(G12C).
a, Crystal structure of K-Ras(G12C) GDP shows Cys 12 (yellow), switch-I (red) and switch-II (blue). Switch-II is partially disordered. b, Percentage modification by compounds 6H05 and 2E07 (n = 3, error bars denote s.d.). c, 6H05 analogue structure–activity relationship. Relative potency = (fragment DR50)/(6H05 DR50), in which DR50 denotes the dose ratio resulting in 50% modification; see Methods. d, Co-crystal structure of 6 (cyan) and K-Ras(G12C) with GDP (grey) and Ca2+ (green). e, Fo − Fc omit map (grey mesh, 2.5σ) of 6 and Cys 12 from d. f, Surface representation of S-IIP around 6 showing hydrogen bonds (yellow lines). Indicated residues make hydrophobic contacts with 6.

