
Extended Data Figure 3. Analysis of compound labelling rate and in vitro specificity.
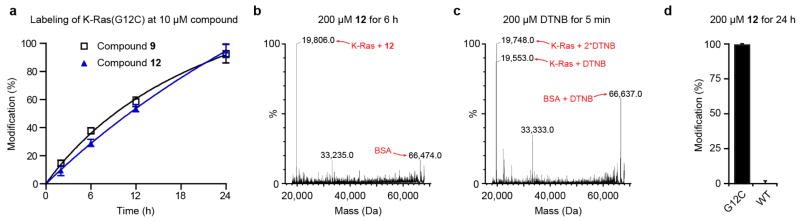
a, Percentage modification of K-Ras(G12C) by compounds 9 and 12 over time (n = 3, error bars denote s. d.). b, Selective single labelling of K-Ras(G12C) by compound 12 in the presence of BSA. c, Quantitative single labelling of BSA and multiple labelling of K-Ras(G12C) by DTNB. d, Comparison of modification of K-Ras(G12C) and wild-type by 12 (n = 3, error bars denote s.d.).