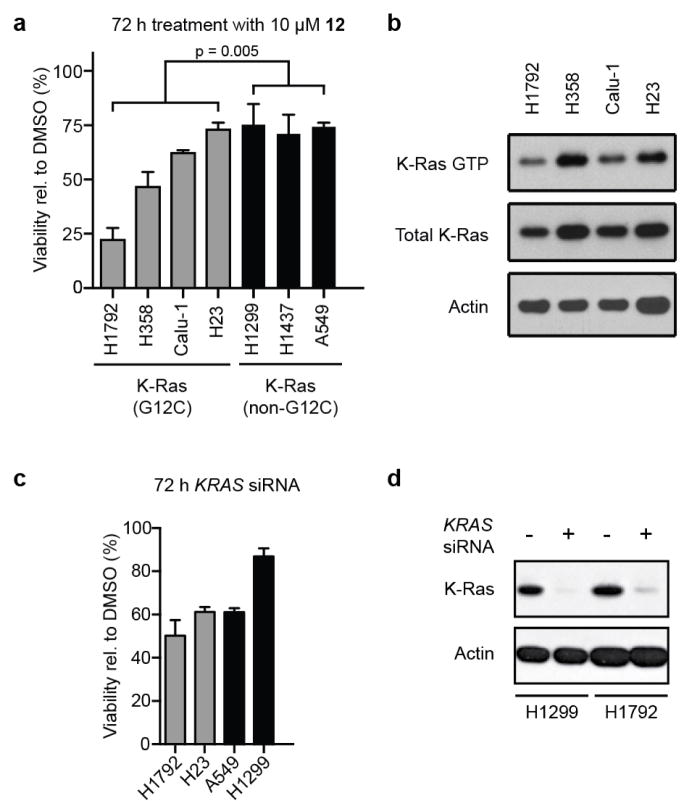
Extended Data Figure 5. Inhibitor sensitivity, K-Ras GTP levels and K-Ras dependency of lung cancer cell lines.
a, Percentage viability after treatment for 72 h with 12 relative to DMSO (n = 3 biological replicates, error bars denote s.e.m.). b, K-Ras GTP levels determined by incubating lysates with glutathione S-transferase (GST)-tagged RBD (Ras-binding domain of C-Raf) immobilized on glutathione beads (n = 3 biological replicates). c, Viability of cell lines evaluated 72 h after transfection with KRAS siRNA (n = 3 biological replicates). d, K-Ras immunoblot showing knockdown after KRAS siRNA (n = 3 biological replicates).

