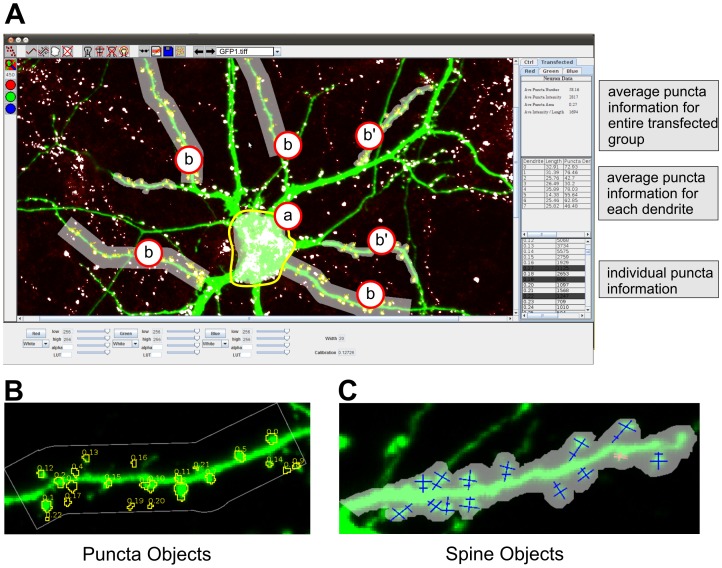
Figure 2. Screenshot of SynPAnal with neuron-themed objects.
A) Screen shot of image analysis being performed with SynPAnal. Cell body (a) object used to measure the fluorescent intensity from the soma of neurons. Dendrite objects (b and b') are used to quantify puncta density and intensity from transfected neurons. Puncta data is displayed in the data panel on the right of the program. The bottom panel shows the puncta information for each individual puncta. The middle panel shows the average puncta information for each dendrite. The top panel shows the average puncta information for the entire transfected group. B) An isolated view of a dendrite object with the contained puncta measuring objects. C) An isolated view of a dendrite object with contained spine measuring objects. For complete description of all features of the software, see SynPAnal User Manual (S1 Text).

