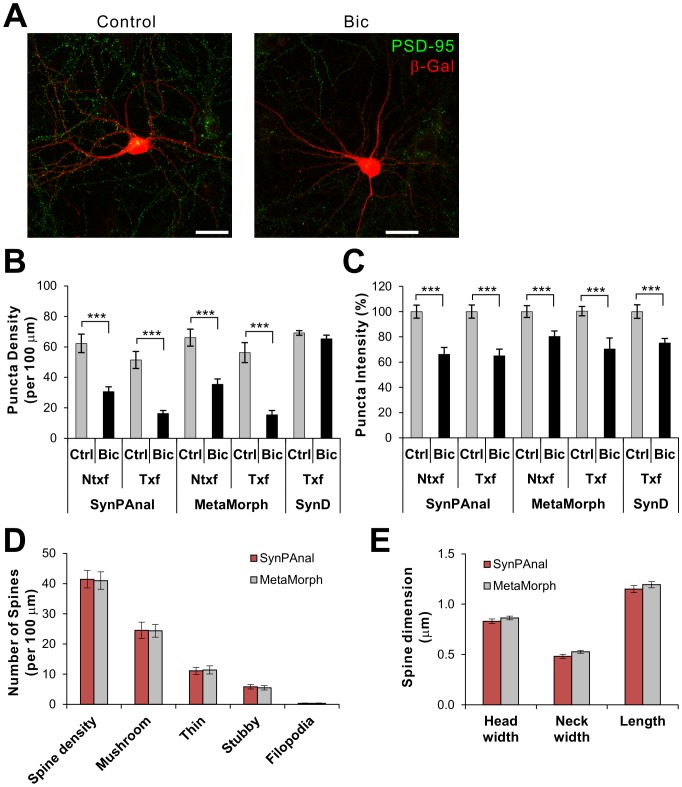
Figure 3. Comparison of the results of puncta and dendritic spine quantification from SynPAnal and MetaMorph.
A) Representative images of hippocampal neurons stained for PSD-95 (green) and β-Gal, which were either mock treated (Control) or 40 µM Bic. B, C) Quantifying puncta density (B) and intensity (C) with SynPAnal produces similar results to MetaMorph. n>12 per condition, *** p<0.001. D, E) Dendritic spine data analyses for the density and types of spines (D) and dimension of spines (E) using SynPAnal and MetaMorph. Spine density was measured from 5 dendritic segments for each neuron (n = 14). The same dendrites were analyzed for both software. Approximately 40-70 spines were analyzed for each neuron.

