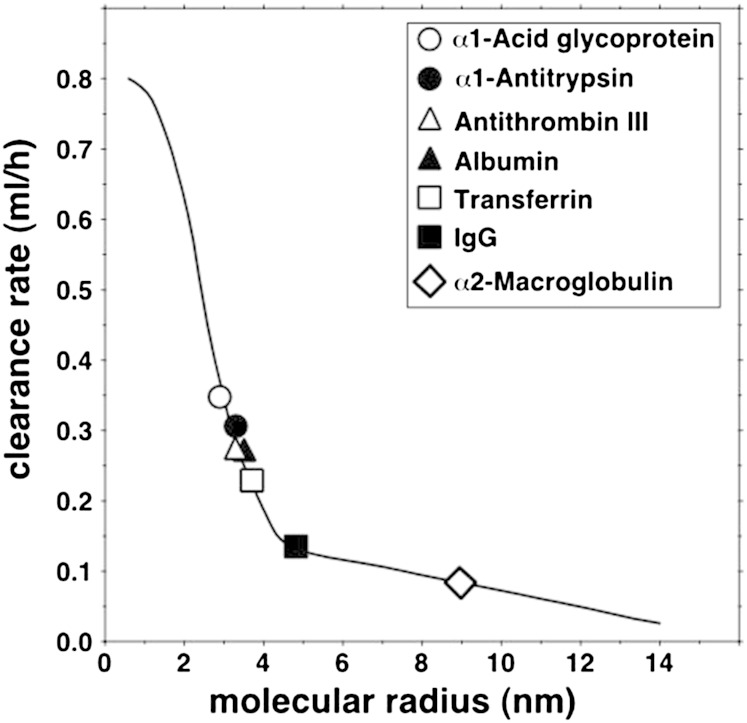
Fig. 1.
Relation of plasma-to-lymph clearance rates of seven globular plasma proteins to their molecular radii. The continuous line is the curve predicted by the two-pore model of ultrafiltration with the following parameters: small pore radius, 4.95 nm; large pore radius, 20.1 nm; numerical ratio of small to large pores, 7,700 to one. The symbols represent the mean measured clearances of the proteins. Mean clearances and SEMs (ml/h) were as follows: α1-glycoprotein, 0.345 ± 0.060; α1-antitrypsin, 0.306 ± 0.060; antithrombin III, 0.270 ± 0.058; albumin, 0.271 ± 0.055; transferrin, 0.228 ± 0.055; immunoglobulin G, 0.135 ± 0.020; α2-macroglobulin, 0.086 ± 0.013.

