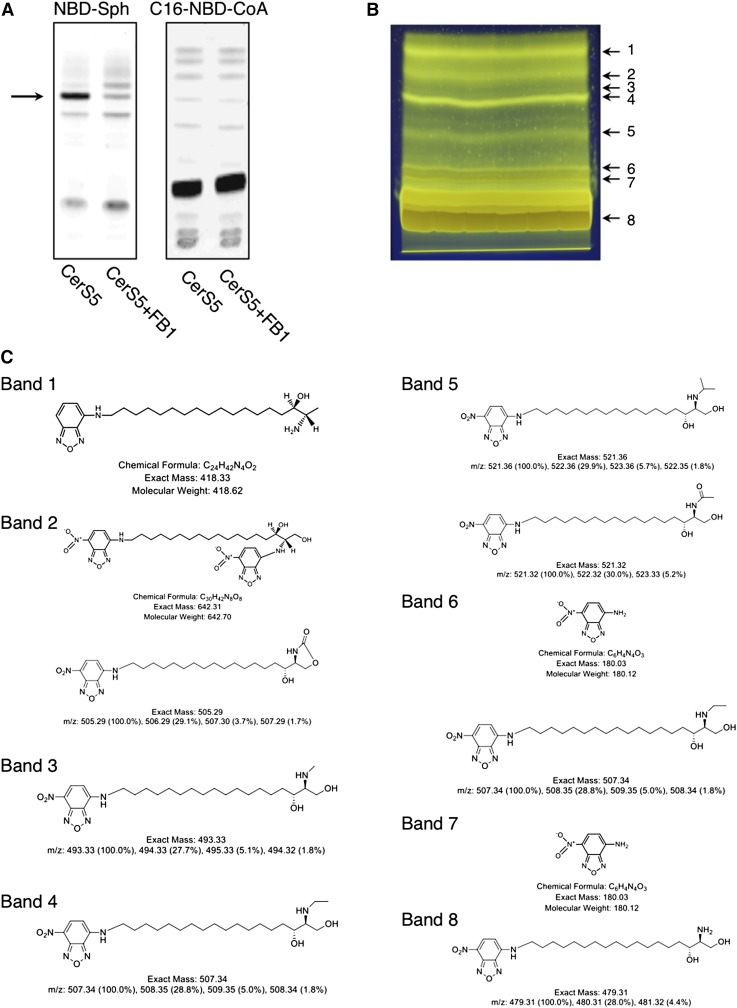
Fig. 2.
NBD-Sph degradation on TLC. A: Homogenates (20 μg of protein) were prepared from CerS5-overexpressing cells. Activity was assayed with or without the CerS inhibitor, fumonisin B1 (FB1), using 15 µM NBD-Sph and 50 μM C16-CoA (left-hand panel) or 15 μM Sph and 50 μM NBD-palmitoyl-CoA (C16-NBD-CoA) (right-hand panel) with 20 μM defatted BSA for 20 min at 37°C. The arrow indicates NBD-ceramide. Other bands are degradation products. B: Preparative TLC plate loaded with 1.48 mg of NBD-Sph. Lipids were separated using chloroform-methanol-water (65:25:4, v/v/v) as the developing solvent. NBD-lipids (numbered 1–8) were extracted. C: The NBD-lipids from B were analyzed by negative ion mode electrospray tandem mass spectrometry. The predicted structures are shown. Band 8 is NBD-Sph.

