Fig. 1.
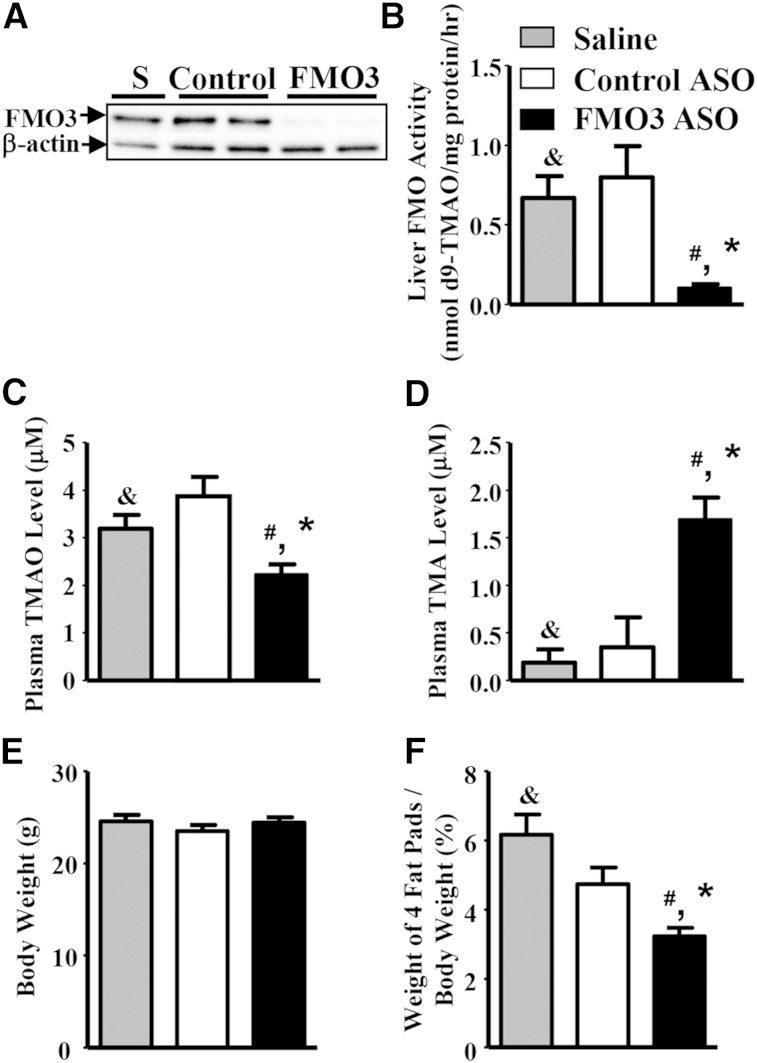
FMO3 knockdown in LDLRKO mice leads to decreased hepatic FMO3 protein and activity levels, altered plasma TMAO and TMA levels, and decreased adiposity. A: Liver FMO3 protein levels of mice treated with saline (S), control ASO (control), or FMO3 ASO (FMO3) were determined by immunoblotting. B: Liver FMO activity (n = 6 for each group) was determined using TMA as the substrate. Plasma TMAO (C) and TMA (D) levels were determined by mass spectrometry (n = 12 for each group). Body weight (E) and percent weight of four fat pads (gonadal, retroperitoneal, subcutaneous, and mesentery fat pads) (F) were normalized by the body weight (n = 12 for each group). Student’s t-test: # P < 0.05 as compared with the saline group; * P < 0.05 as compared with the control ASO group. ANOVA: & P < 0.05 between the means of the three treatment groups.

