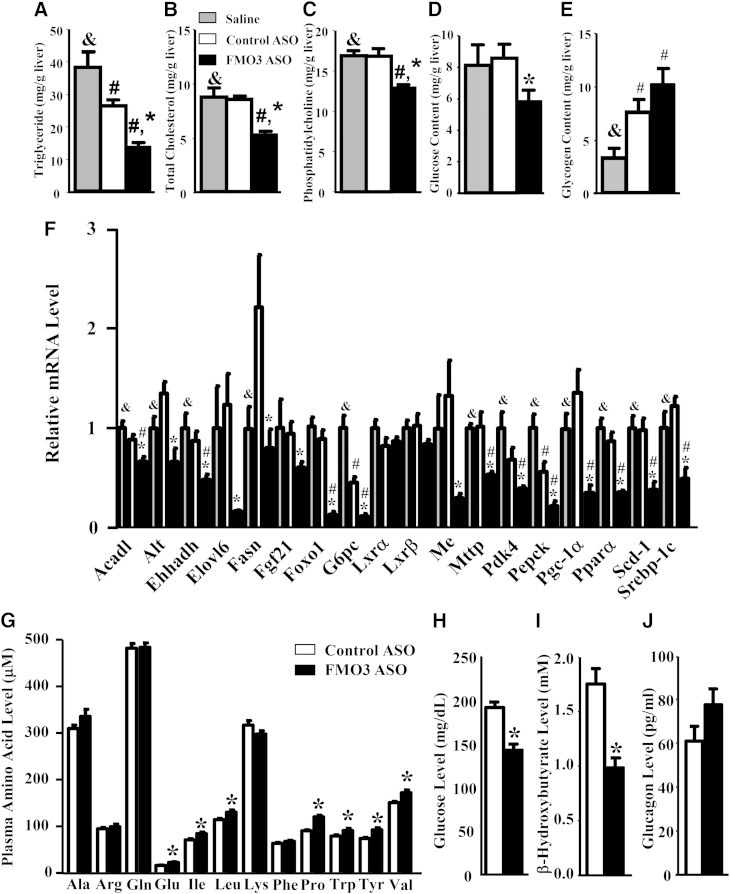
Fig. 5.
FMO3 knockdown in LDLRKO mice leads to altered hepatic glucose and lipid levels, altered hepatic gene expression, and changes in plasma metabolites. Liver TG (A), TC (B), phosphatidylcholine (C), glucose (D), and glycogen (E) levels were determined in LDLRKO mice treated with saline, control ASO, or FMO3 ASO and fed the Western diet (n = 8 for each group). F: Liver mRNA levels (n = 6 for each group) of genes involved in lipid and glucose metabolism were quantified by quantitative PCR and normalized by the mRNA level of the housekeeping gene, Rpl13a. In a separate set of mice, circulating levels of amino acids (G), glucose (H), β-hydroxybutyrate (I), and glucagon (J) were determined (n = 10 for each group). Symbols are the same as in Fig. 1.

