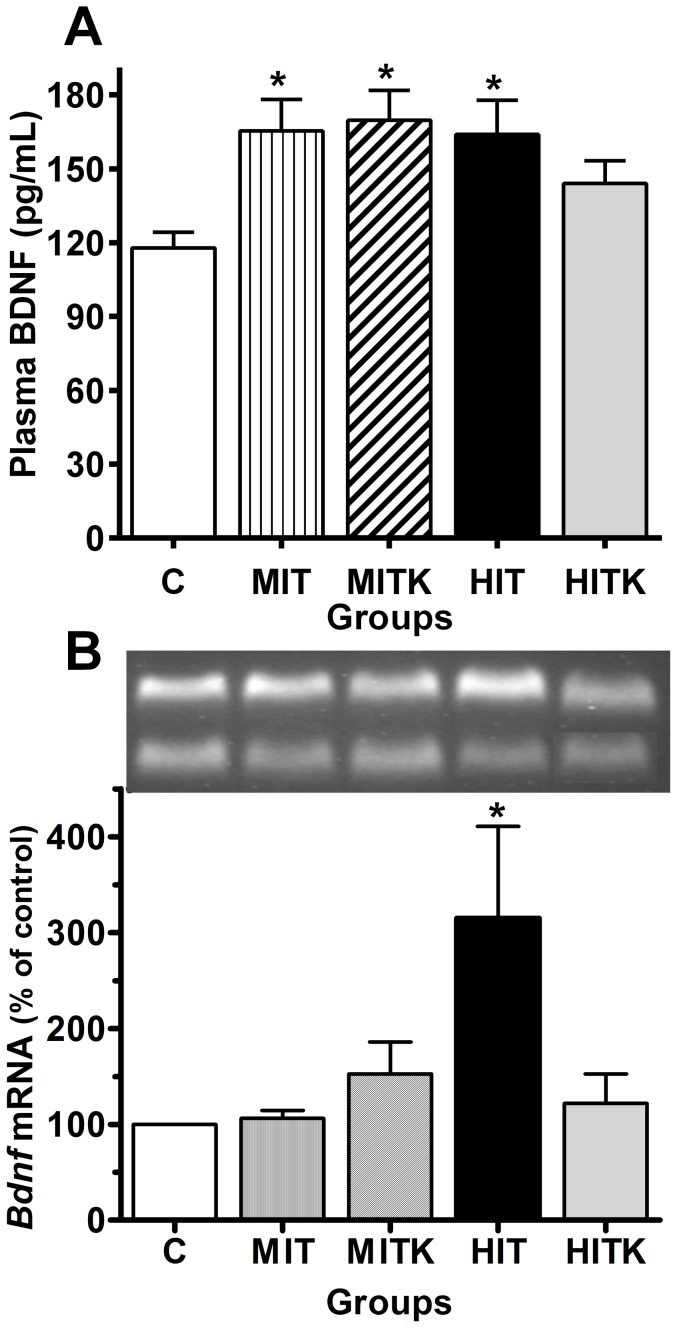
Figure 2. Effects of an 8-week treadmill exercise regimen on all studied groups shown in the protocol.
BDNF levels in pg/mL (A) and relative BDNF expression in the soleus muscle (B). Real time RT-PCR reactions were performed with 100 ng of total RNA and specific primers. Representative PCR bands are shown in the gel enclosure; the larger band corresponds to the HIT group and the lower bands indicate the β-actin housekeeping gene expression. Values are shown as means ± S.E. from 6 independent samples; *p<0.05 vs. control, ANOVA and Tukey's tests.

