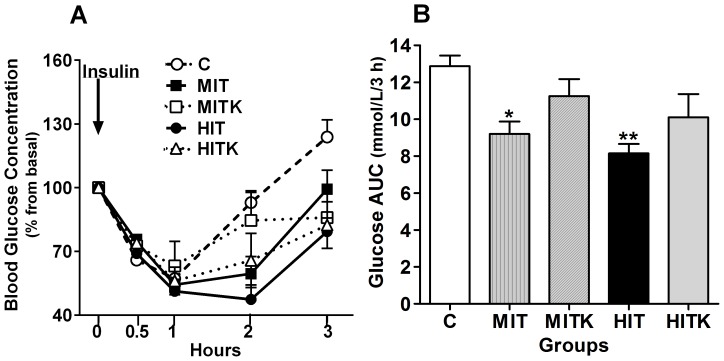
Figure 4. Insulin tolerance test in all experimental groups.
All rats received i.p. injections of 0.08 mg insulin/100 g body weight at the 0 time point. A) Glucose concentrations expressed as % basal. B) Glucose concentrations from (A), expressed as the area under the curve (AUC) in % basal during a 3-h period. Values are shown as means ± S.E. from 6 independent samples; *p<0.05, ANOVA and Tukey' test.

