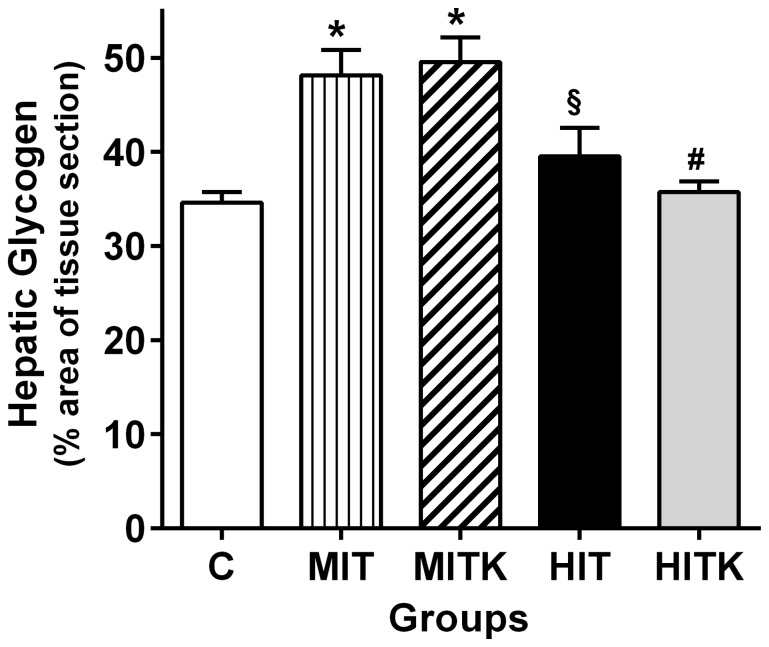
Figure 6. Hepatic glycogen levels in studied rats after insulin injection into the portal veins (0.2 mL 10−6M), effects of an 8-week treadmill exercise regimen.
Liver fragments were stained according to the PAS method (n = 6 per group). Six representative fields from at least 4 different liver fragments per rat (80 and 90 µm2) were analyzed. Data are shown as means ± SEM. *p<0.05 vs. the C group, #p<0.05 vs. the MIT group, and §p<0.05 vs. the HITK group; ANOVA and Tukey's tests.

