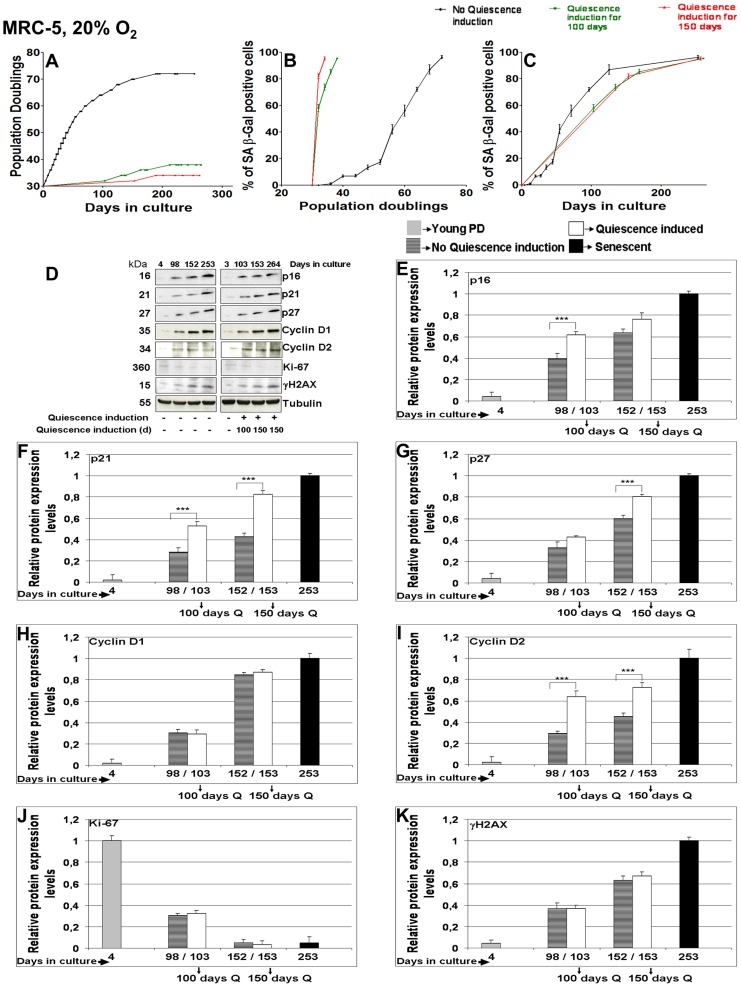
Figure 2. Effect of long term quiescence induction (100 or 150 days) in MRC-5 fibroblasts maintained at 20% O2.
(A) Growth curve of 3 independent MRC-5 fibroblast cell lines (control with no quiescence induction, and cell lines where quiescence was induced for 100 or 150 days respectively by contact inhibition and then maintained in culture till they approached senescence) maintained in culture at 20% O2 as triplicates from an early PD until senescence at late PDs. Each growth curve is measured in triplicate. Data points of all measurements are displayed (not the mean). (B & C) Percentage of SA-β gal positive cells at different time points of their growth in culture in the control MRC-5 fibroblast cell line and in the cell lines where quiescence was induced for 100 or 150 days respectively. Fig. 2 B and C are plotted with PDs and days in the y-axis respectively. Each curve is measured in triplicate, the mean value is displayed with error bar (± S.E). (D) The blots show the protein expression levels of p16, p21, p27, Cyclin D1, Cyclin D2, Ki-67 and γH2A.X in MRC-5 fibroblast cell lines (subjected to different culture conditions of 100 or 150 days quiescence by contact inhibition and no quiescence induction) maintained in culture at 20% O2 until they approached senescence at late PD. The up or down-regulation was signified by the presence or absence of the bands in Western Blots. (E, F, G, H, I, J, K) Comparison of mean fold change of protein expression levels of p16 (E), p21 (F), p27 (G), Cyclin D1 (H), Cyclin D2 (I), Ki-67 (J) and γH2A.X (K) in MRC-5 cell lines where quiescence was induced for 100 or 150 days by contact inhibition respectively compared to controls at corresponding span of time in culture. Cell lines were maintained at 20% O2 as triplicates. The bars indicate the mean ± S.D. *** p<0.001 - significantly different compared to fibroblasts with PD assigned 1. n = 3.

